Case study
Redesigning Credit Karma’s cashflow surfaces
Challenge
Help users understand the past and plan what comes next
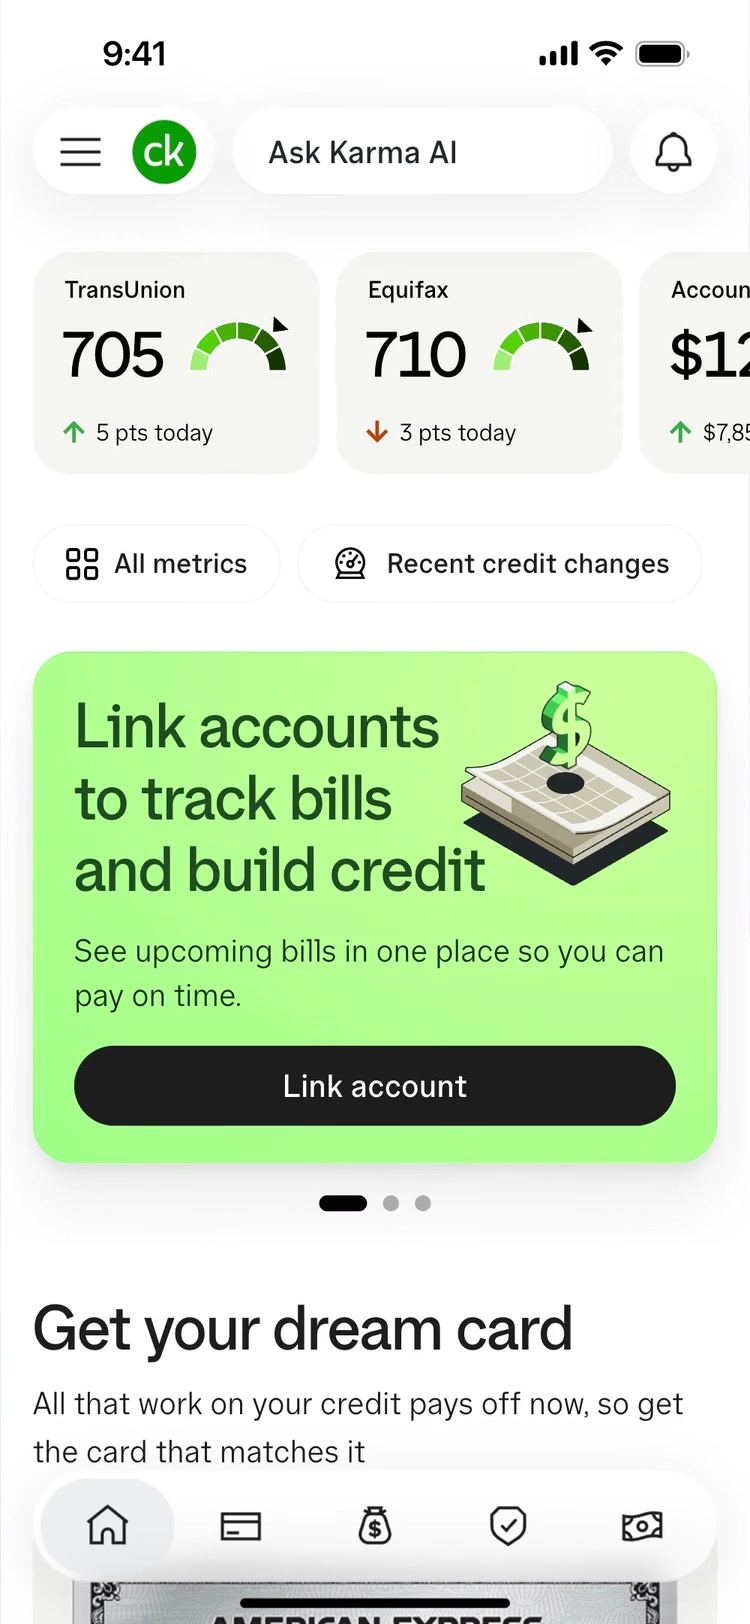
Cashflow was Credit Karma’s most-visited account surface, but it was designed for reviewing past activity. To plan ahead, users had to piece together income, bills, and expenses across tabs and menus. They couldn’t quickly answer what was coming, when it was due, or what they could safely spend. Any change had to preserve familiar workflows on a surface millions already used.
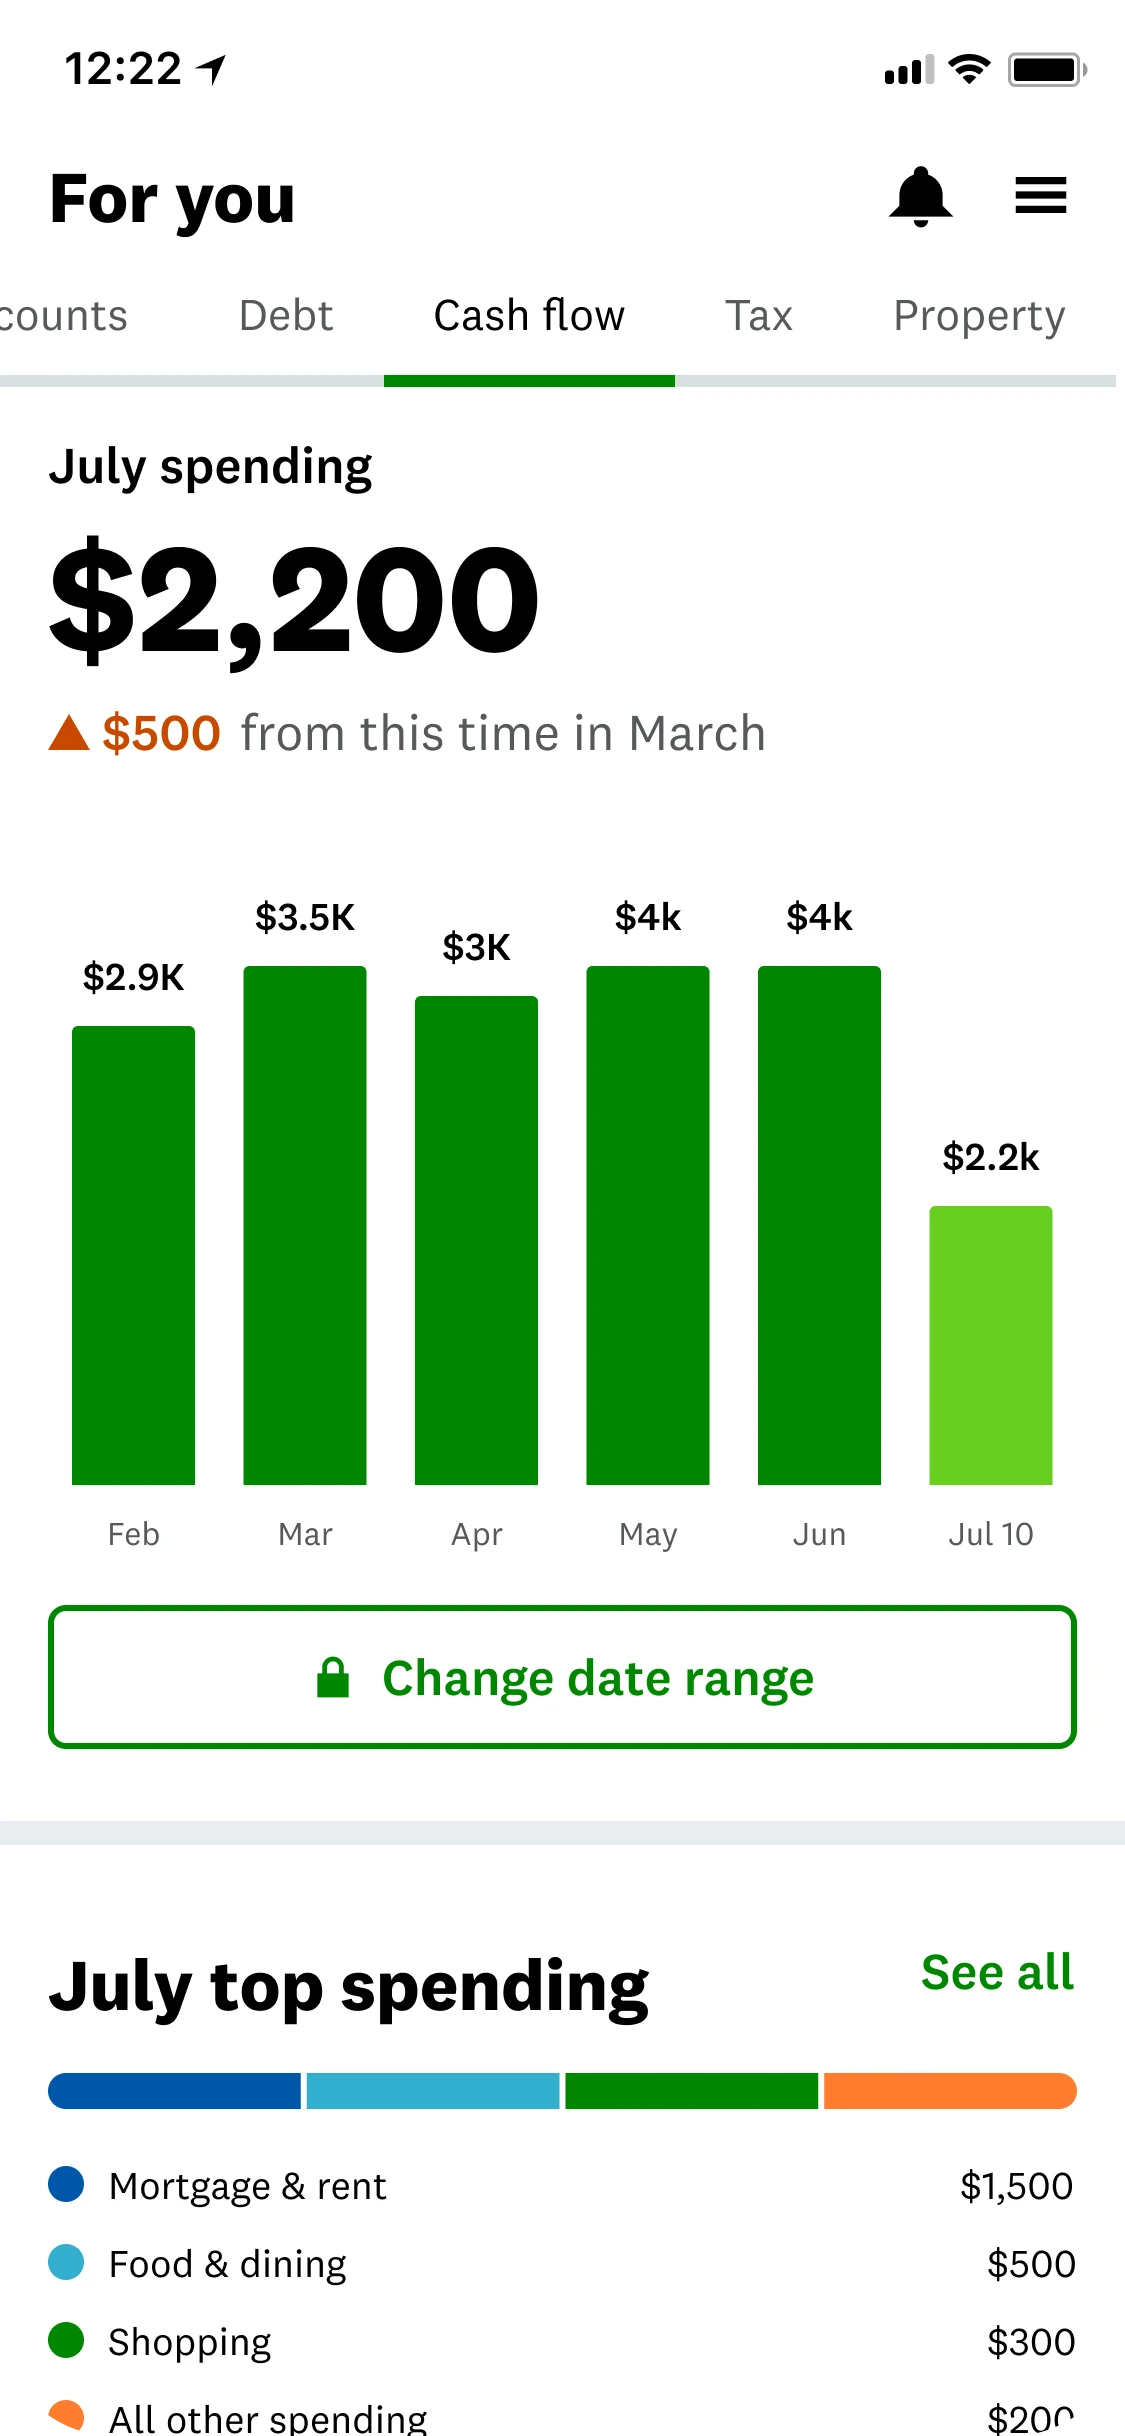
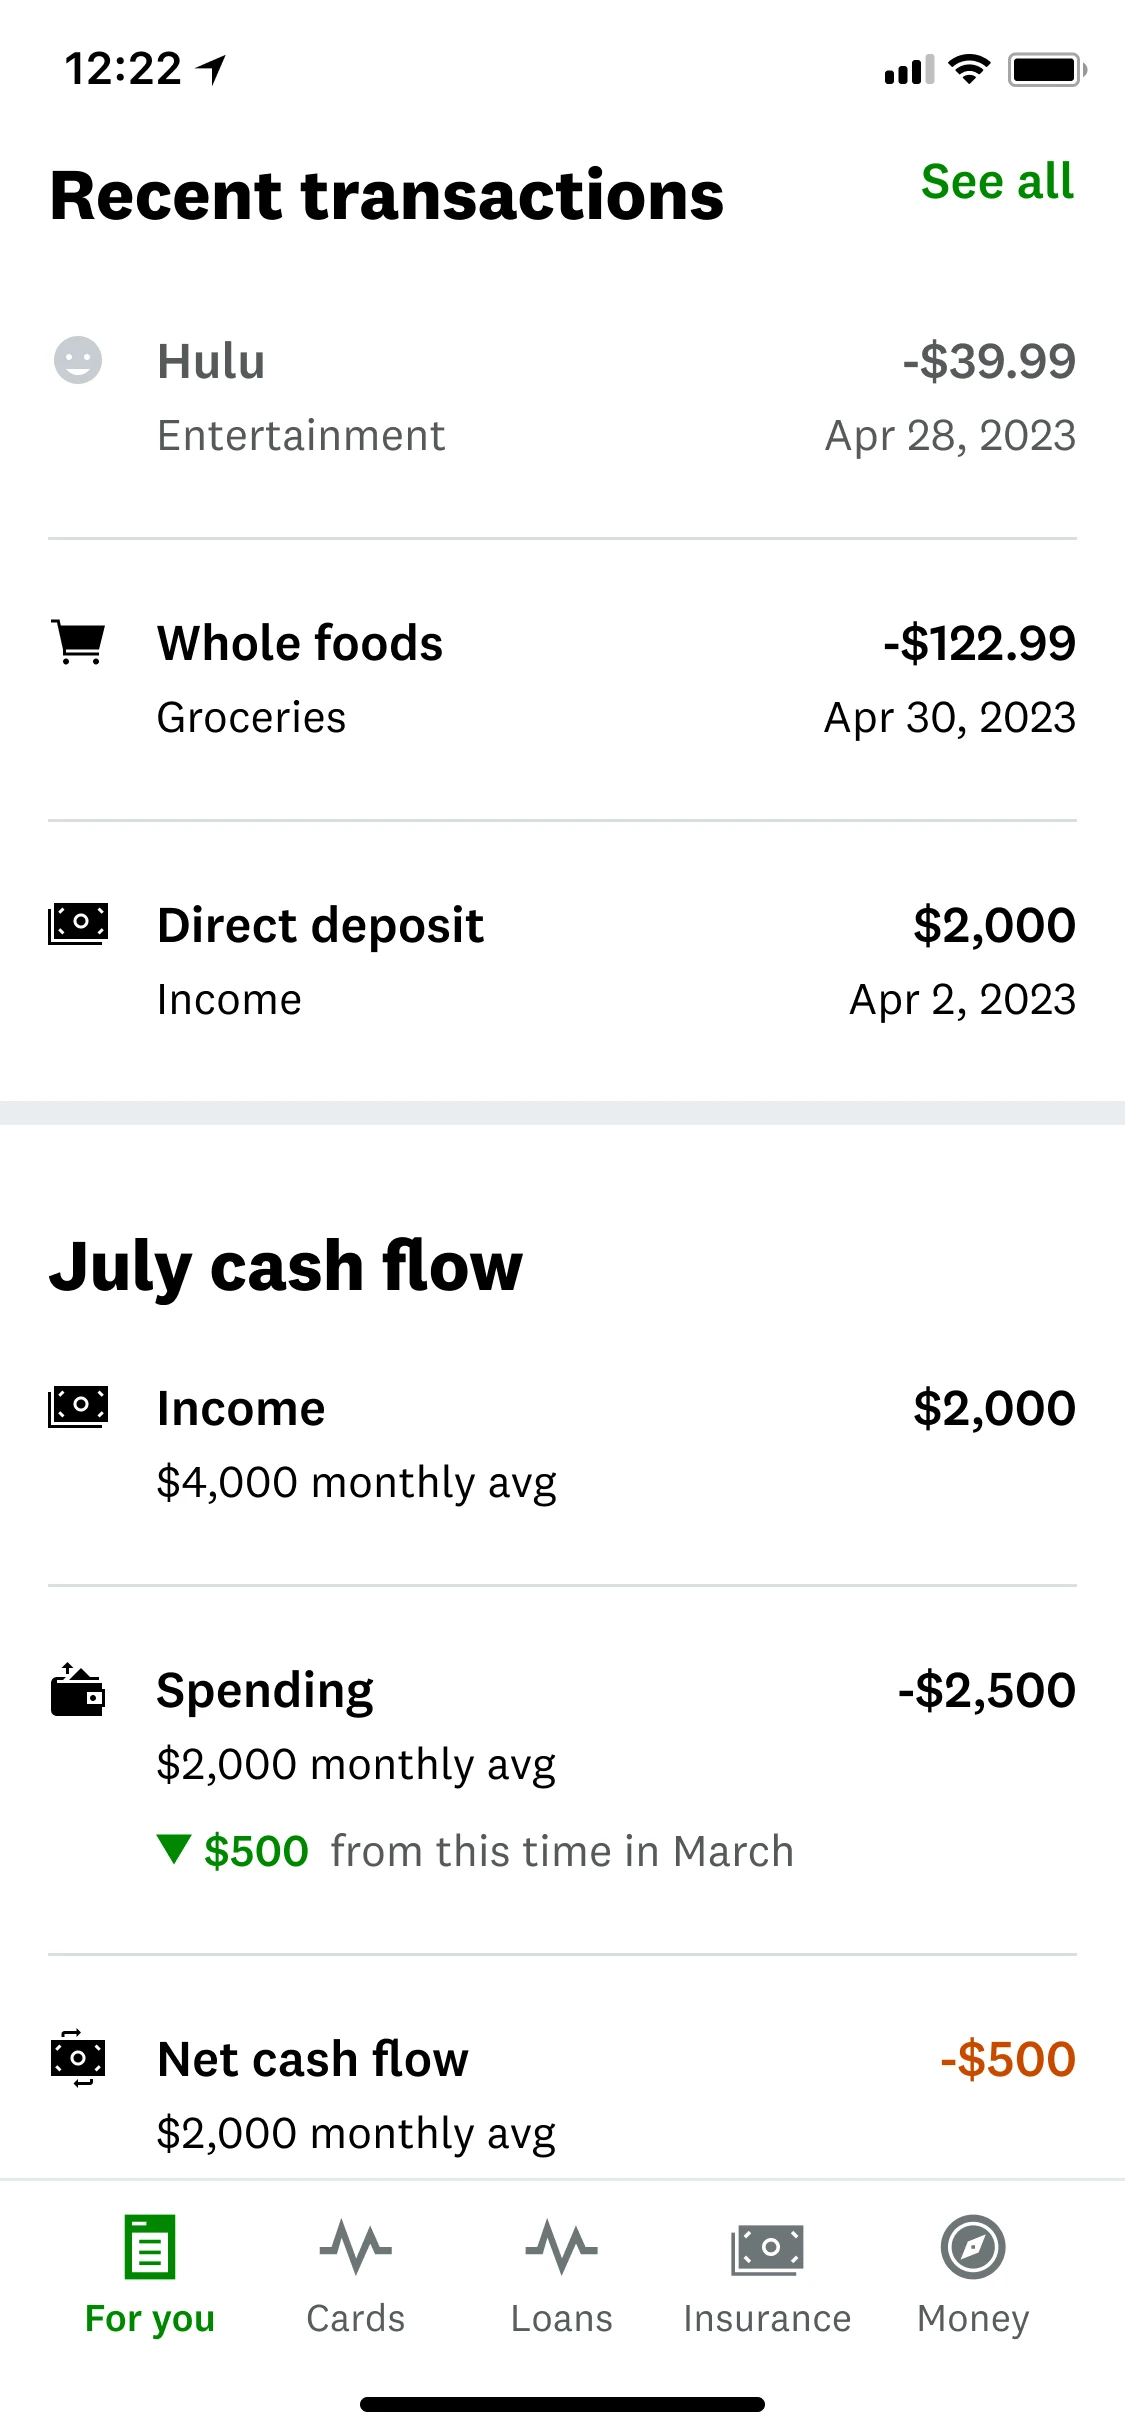
Before: a fragmented, backward-looking experience that made users hunt across views for answers and offered no way to see what was coming next.
Approach
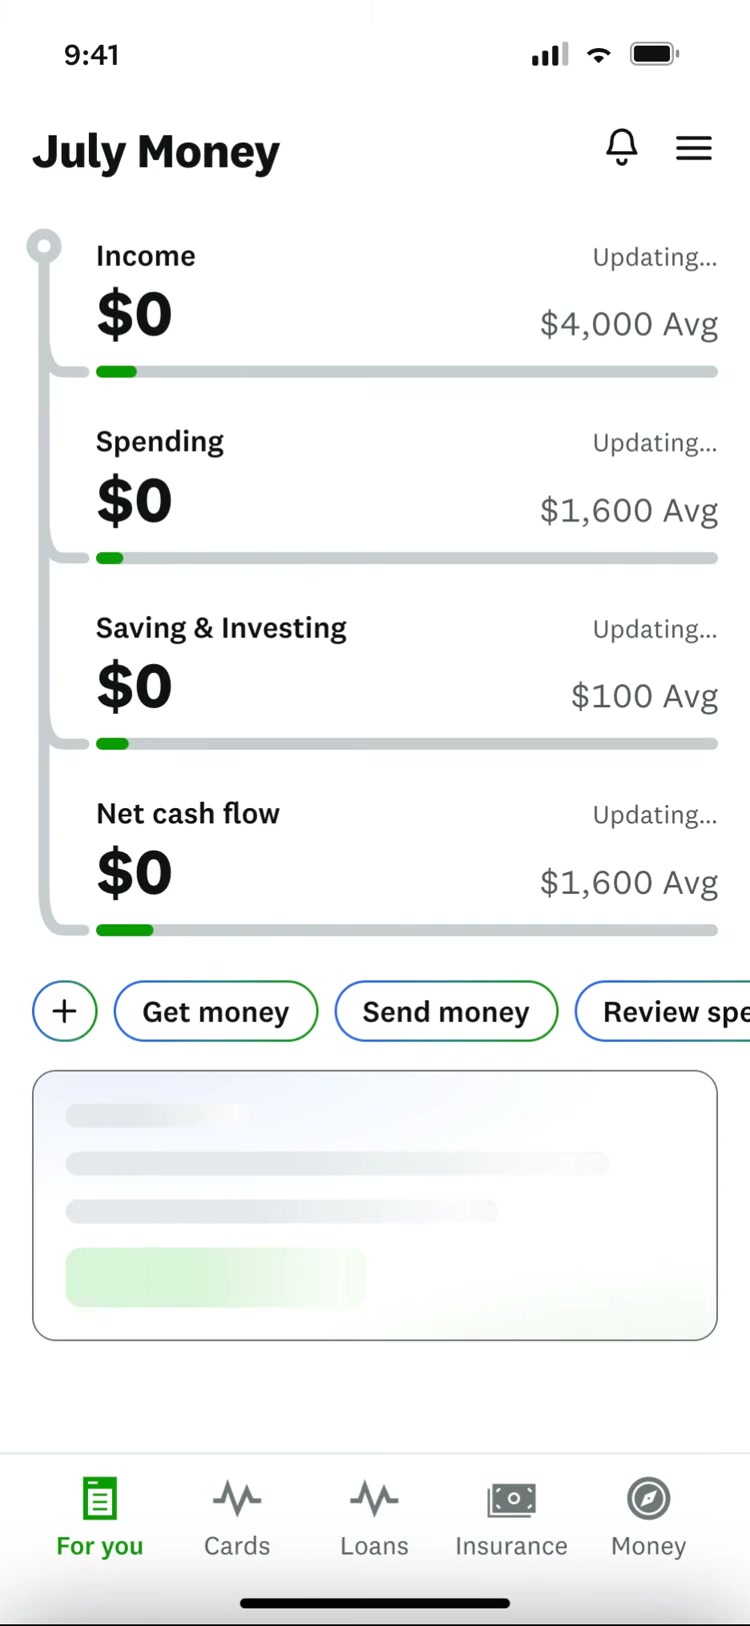
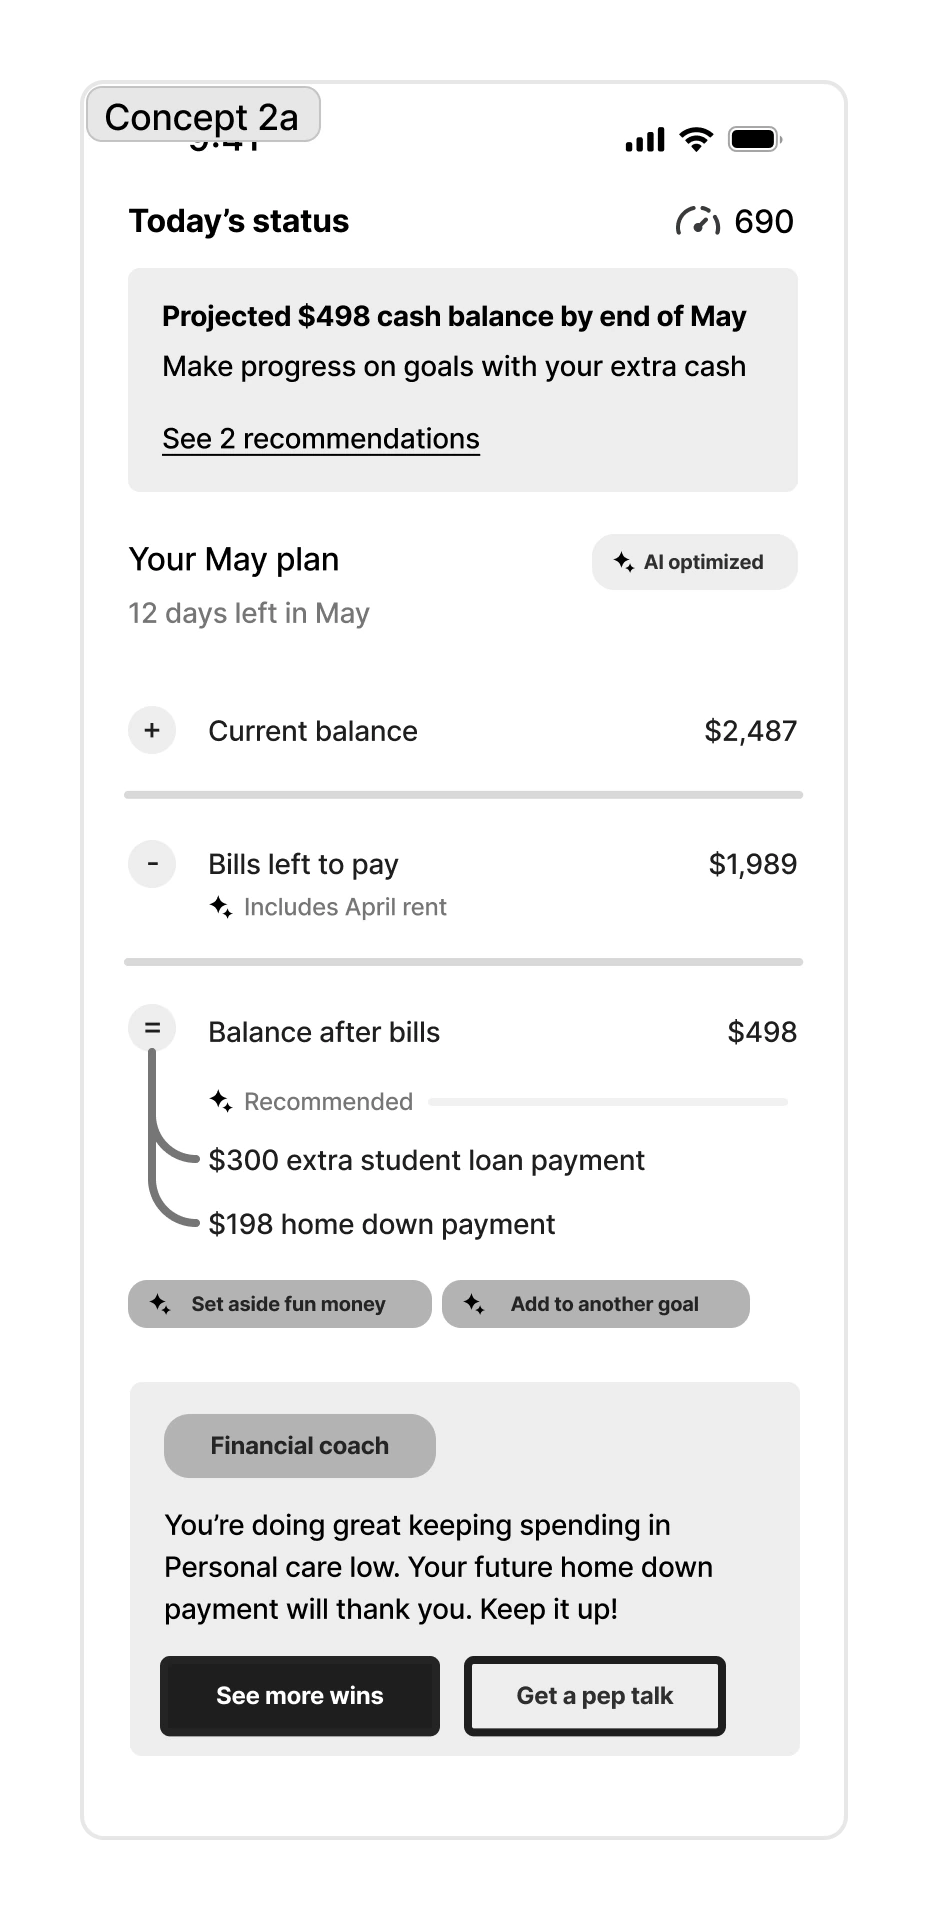
I had designed a concept called the Money Map during a 3-year vision project with Credit Karma’s co-founders. It was a single monthly view of money coming in, bills and expenses going out, and what remained, so users could see what they could safely spend. When the work moved into product development, I treated it as a hypothesis to test. Working prototypes built with AI tools and real financial data showed where the model needed to change. Three controlled experiments guided what we built next.
I used evidence to
redirect the original Money Map
The Money Map had executive backing, but it still needed evidence before becoming part of our roadmap.
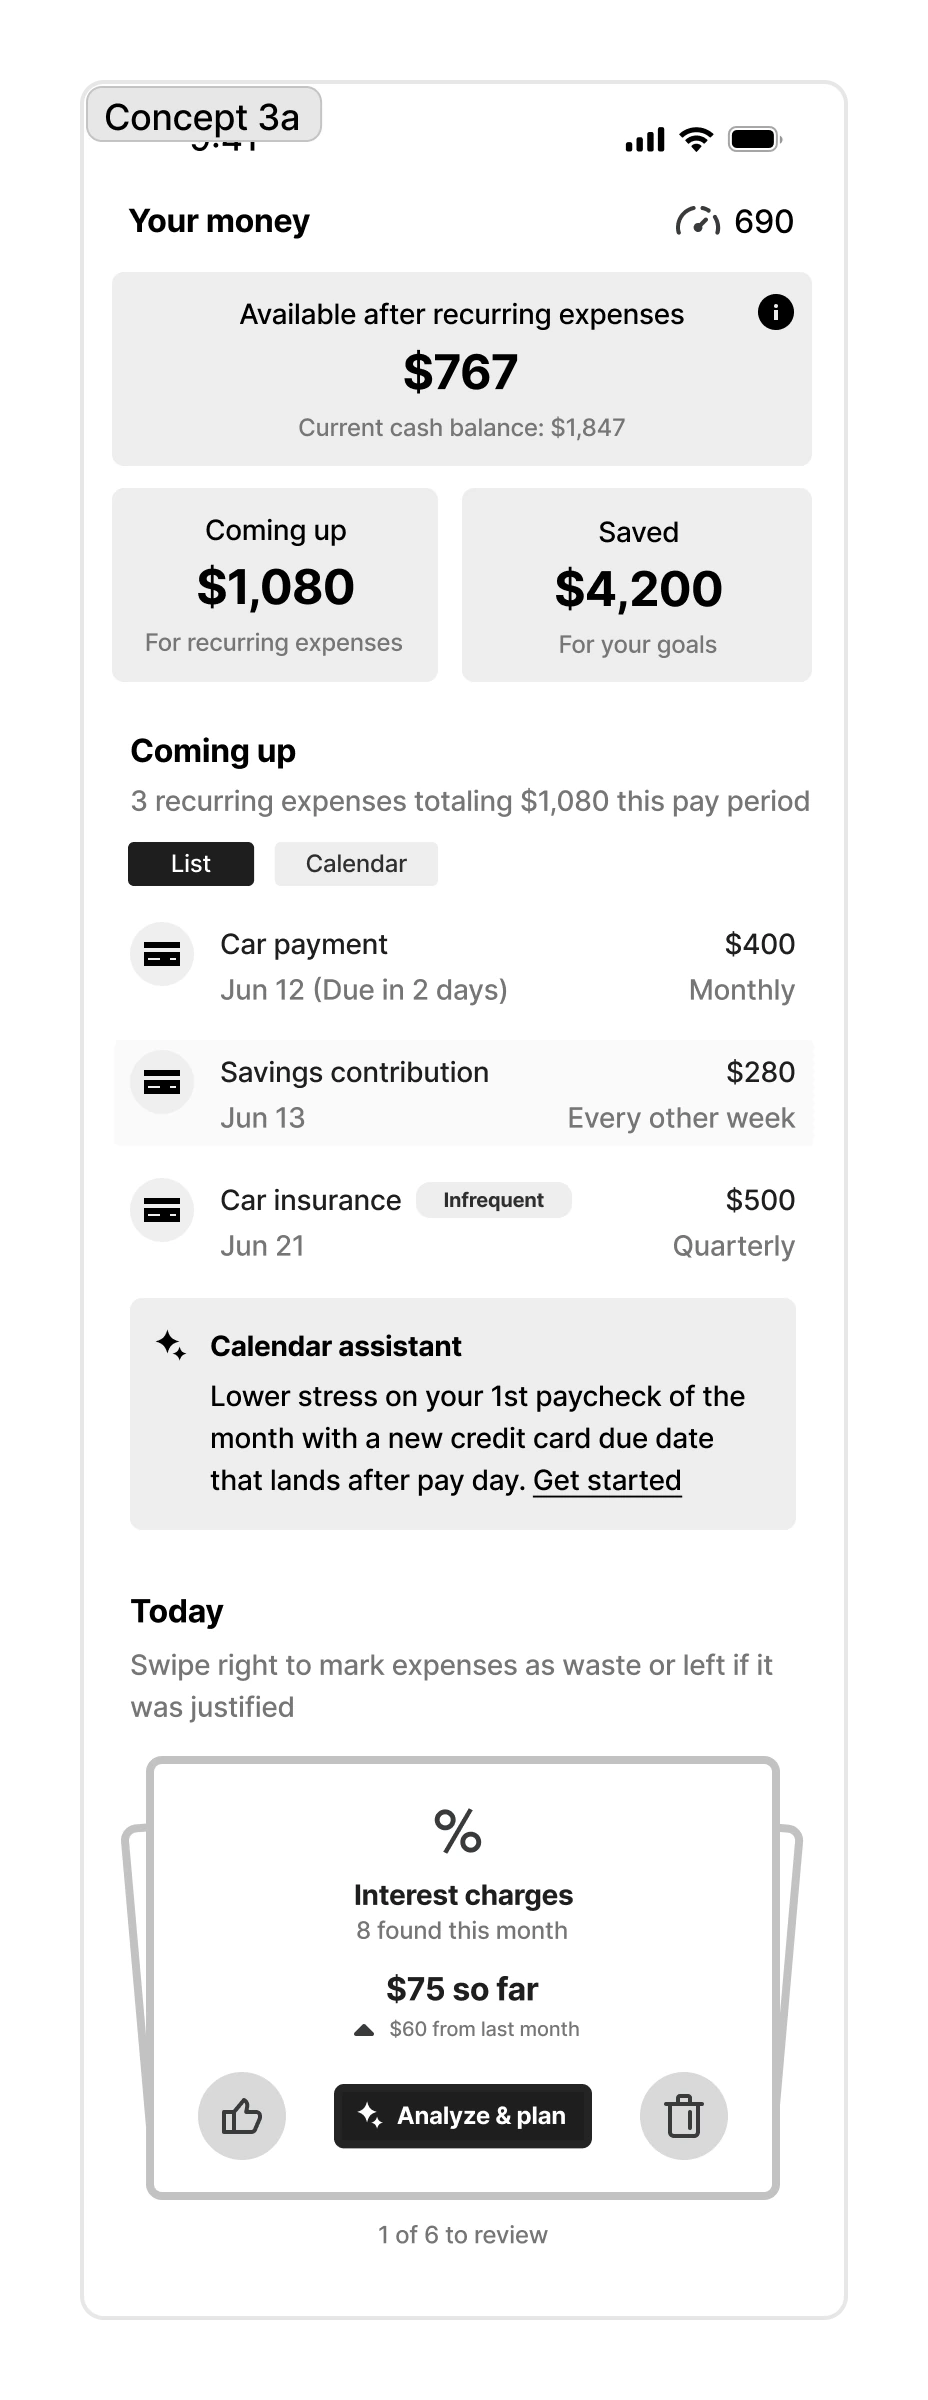
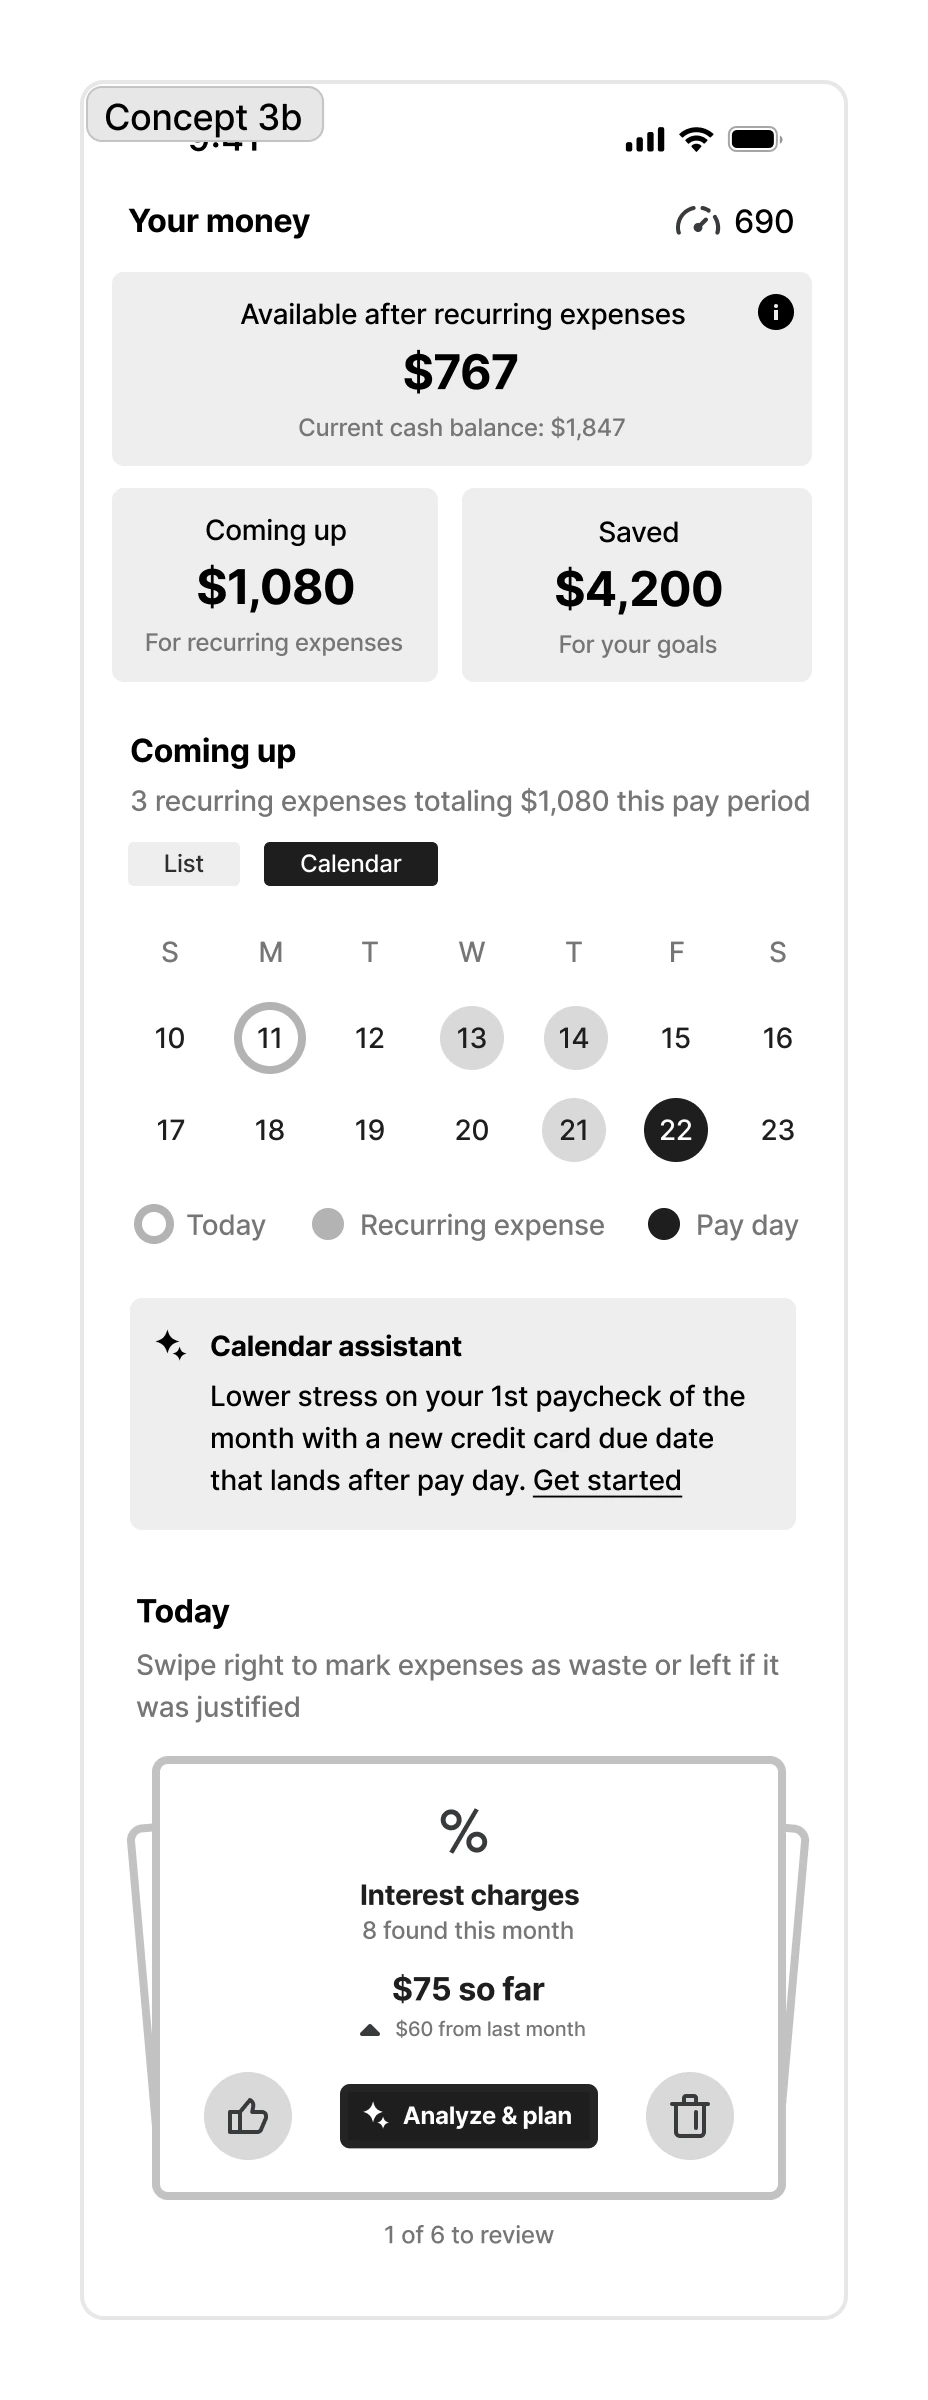
I led interviews and collaborative design sessions with 16 users and worked with a Market Research colleague to understand broader trends in how people managed bills and spending. A recurring pattern was that people used spreadsheets, mental math, and repeated account checks to understand upcoming expenses. Calendar-based concepts made those obligations easier to understand.
Based on concept testing and continued design iteration, I recommended refocusing Cashflow around timing, due dates, recurring transactions, and the period before the next paycheck. The new direction centered on three questions: What is coming? When is it due? What can I safely spend?
Real financial data helped users articulate what the model was missing
Using a working prototype built with AI coding agents, I tested each participant’s real financial data and uncovered conditions sample accounts would likely have missed. We collected income, rent, car payments, bills, subscriptions, and payment dates before each session, then adjusted those inputs together to see how the forecast changed. The sessions surfaced irregular insurance expenses that could throw off several months of planning, shifting income, and planned credit card payments users wanted to adjust based on what they could afford. Those discoveries changed the product direction.
The system needed to calculate a useful default, let users adjust the inputs, and show where the answer came from. That led to adjustable plans, clearer timing, and an inspectable calculation.
Launching experiments in production
I worked with product and engineering partners to structure each release around a different product risk before increasing the investment.
Recurring Transactions experiment
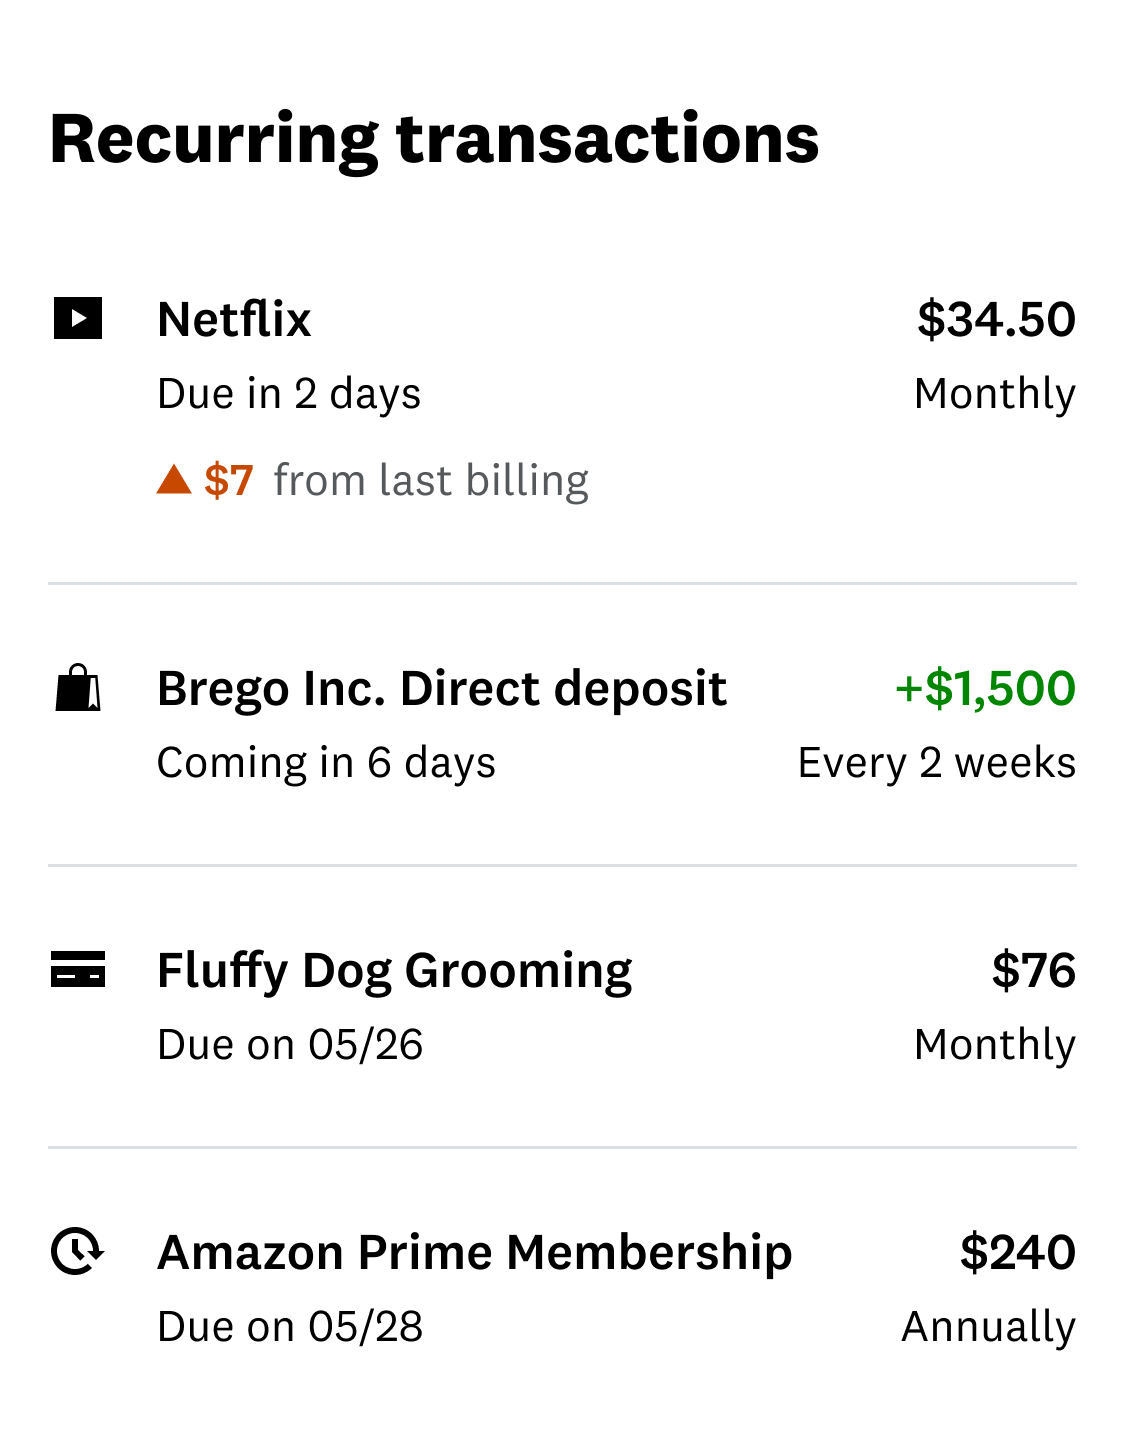
Can we reliably identify what is coming?
We shipped Recurring Transactions and upcoming due dates to live traffic. The controlled experiment increased monthly retention among users with connected accounts by 3.07%, giving us evidence to continue into Bill Calendar and Available Cash.
Recurring Transactions experiment
- 3.07%
- Lift in monthly retention among users with connected accounts
Bill Calendar experiment
Does organizing obligations by time help users return?
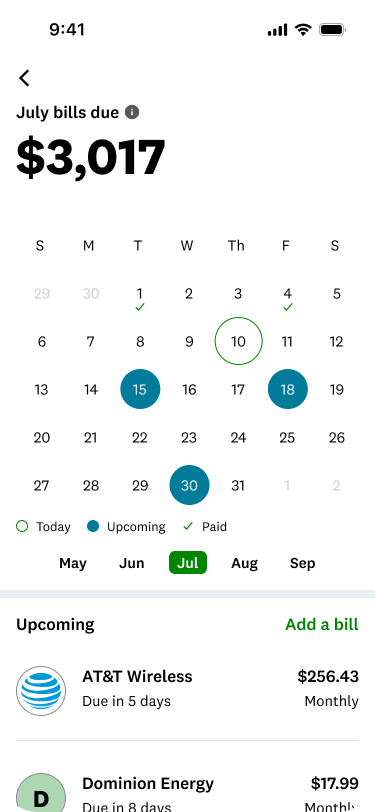
I built Bill Calendar on the Recurring Transactions model, combining predicted income, recurring expenses, bills, and payment status in one view. With engineering partners, I designed the month-to-month animation and front-end safeguards so data delays did not mark payments as missed and users were notified of subscription price changes. Users could move across months and spot irregular charges before they landed.
To make obligations easier to scan, I used transaction data to identify common merchants, secured their logos, and worked with Legal to approve their use. I worked with product and engineering partners to ship the experience. The controlled experiment increased seven-day return by 3.04% on iOS and 6.80% on Android, relative to control.
Bill Calendar experiment
- 3.04%
- Lift in 7-day return on iOS, relative to control
- 6.80%
- Lift in 7-day return on Android, relative to control
Available Cash experiment
Can the system give users one trusted metric to anchor on?
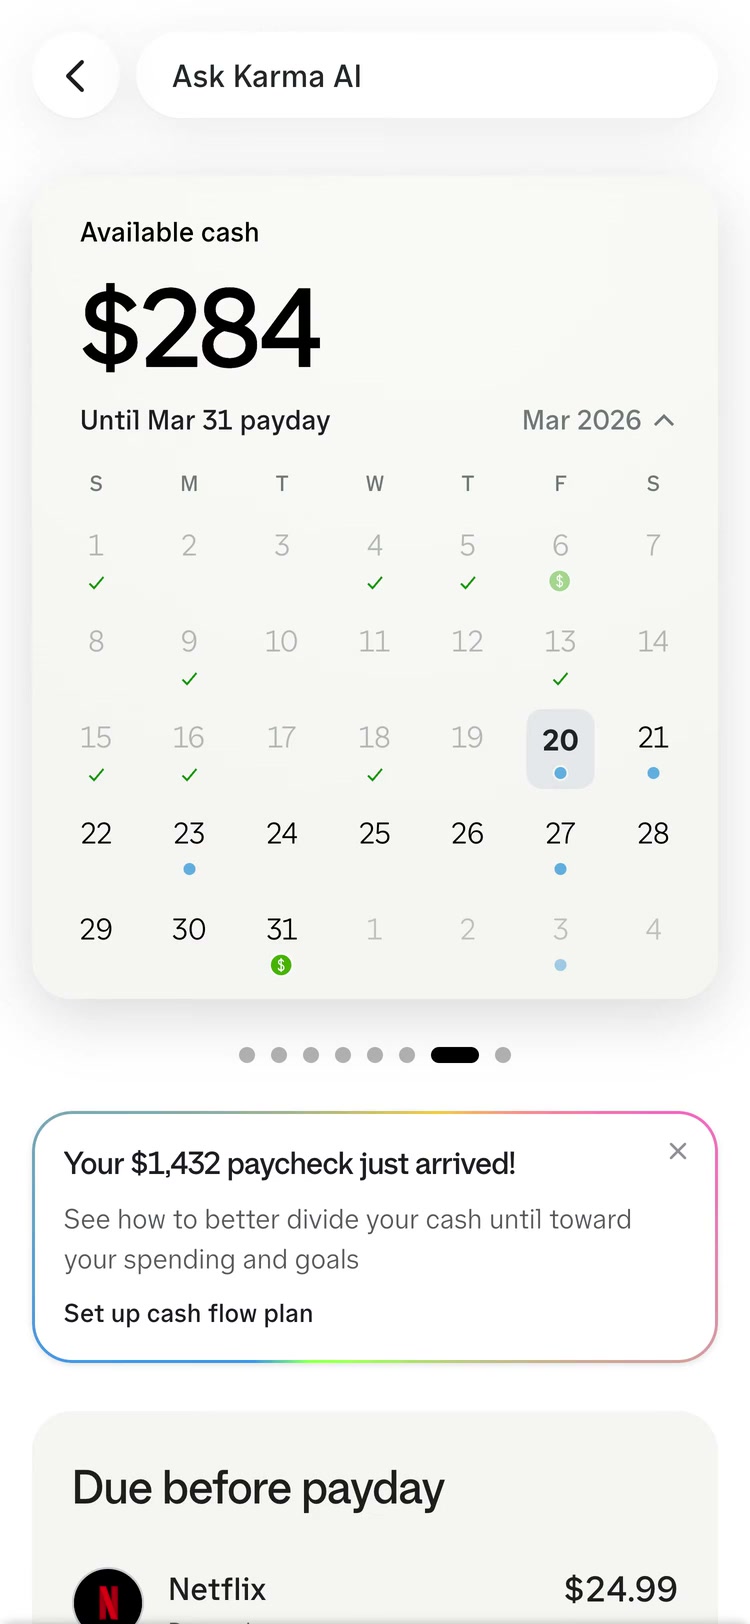
Available Cash built on Recurring Transactions and Bill Calendar. I designed one metric around a recurring user question: How much money do I have until my next paycheck? It subtracted bills and expenses due before payday from the user’s checking balance, replacing mental math with one answer.
Users could choose a two-week or monthly view. We increased the recurring-transactions model from weekly to daily runs so expected income, bills, and expenses stayed current. I worked with product and engineering teammates to bring Available Cash to market. The controlled experiment increased weekly active use by 2.9%, supporting continued investment in the direction.
Available Cash experiment
- 2.9%
- Lift in weekly active use
Making Cashflow explorable
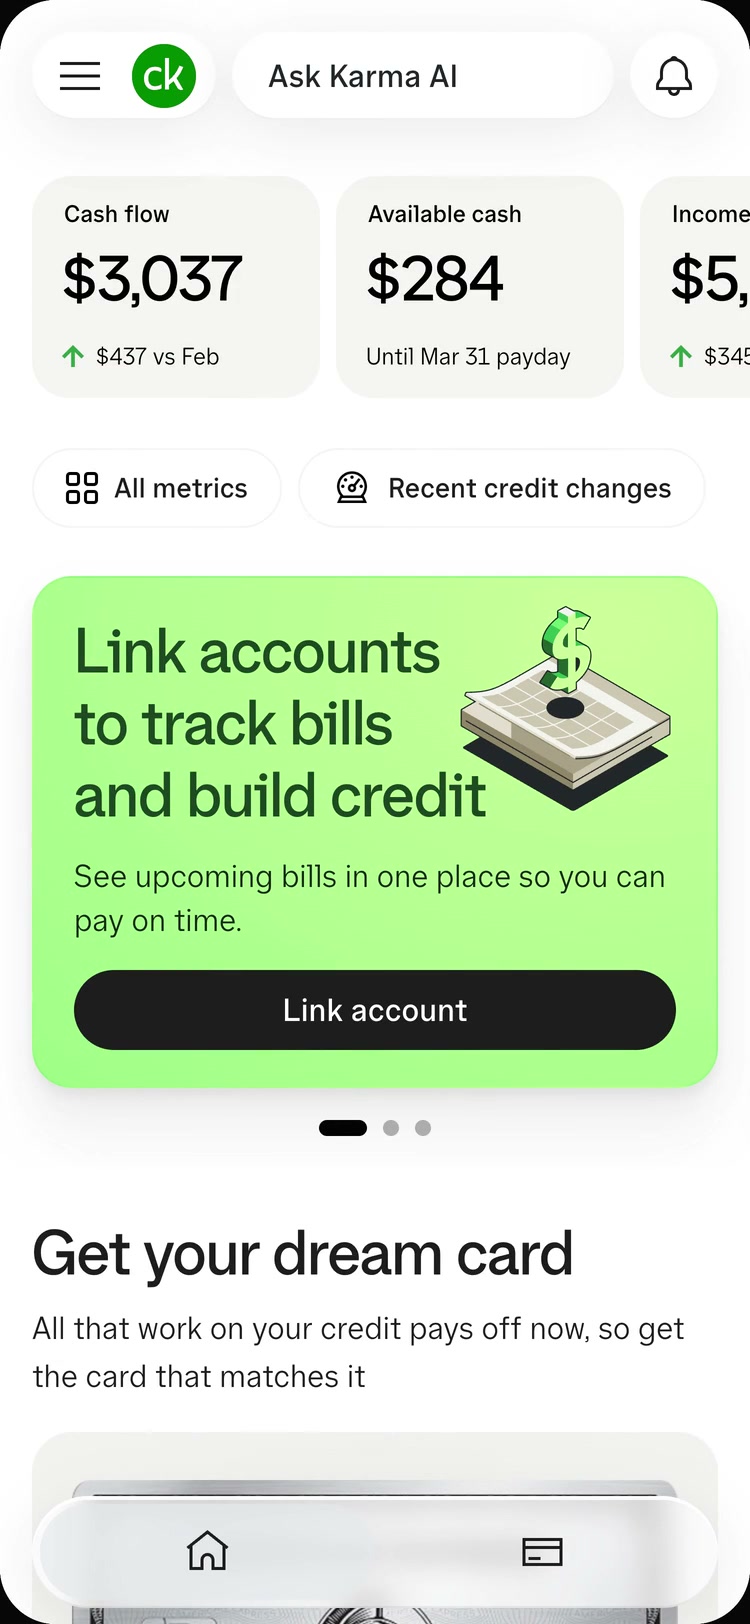
I redesigned the backward-looking Cashflow experience so users could explore past spending and income through one connected interface. Across Cashflow, Spending, and Income, bar charts became navigation. I designed how they animated between states so users could tap a month or swipe through time while totals, categories, and transaction lists updated together. Calendar views responded to horizontal swipes and shifted between two-week and monthly timeframes.
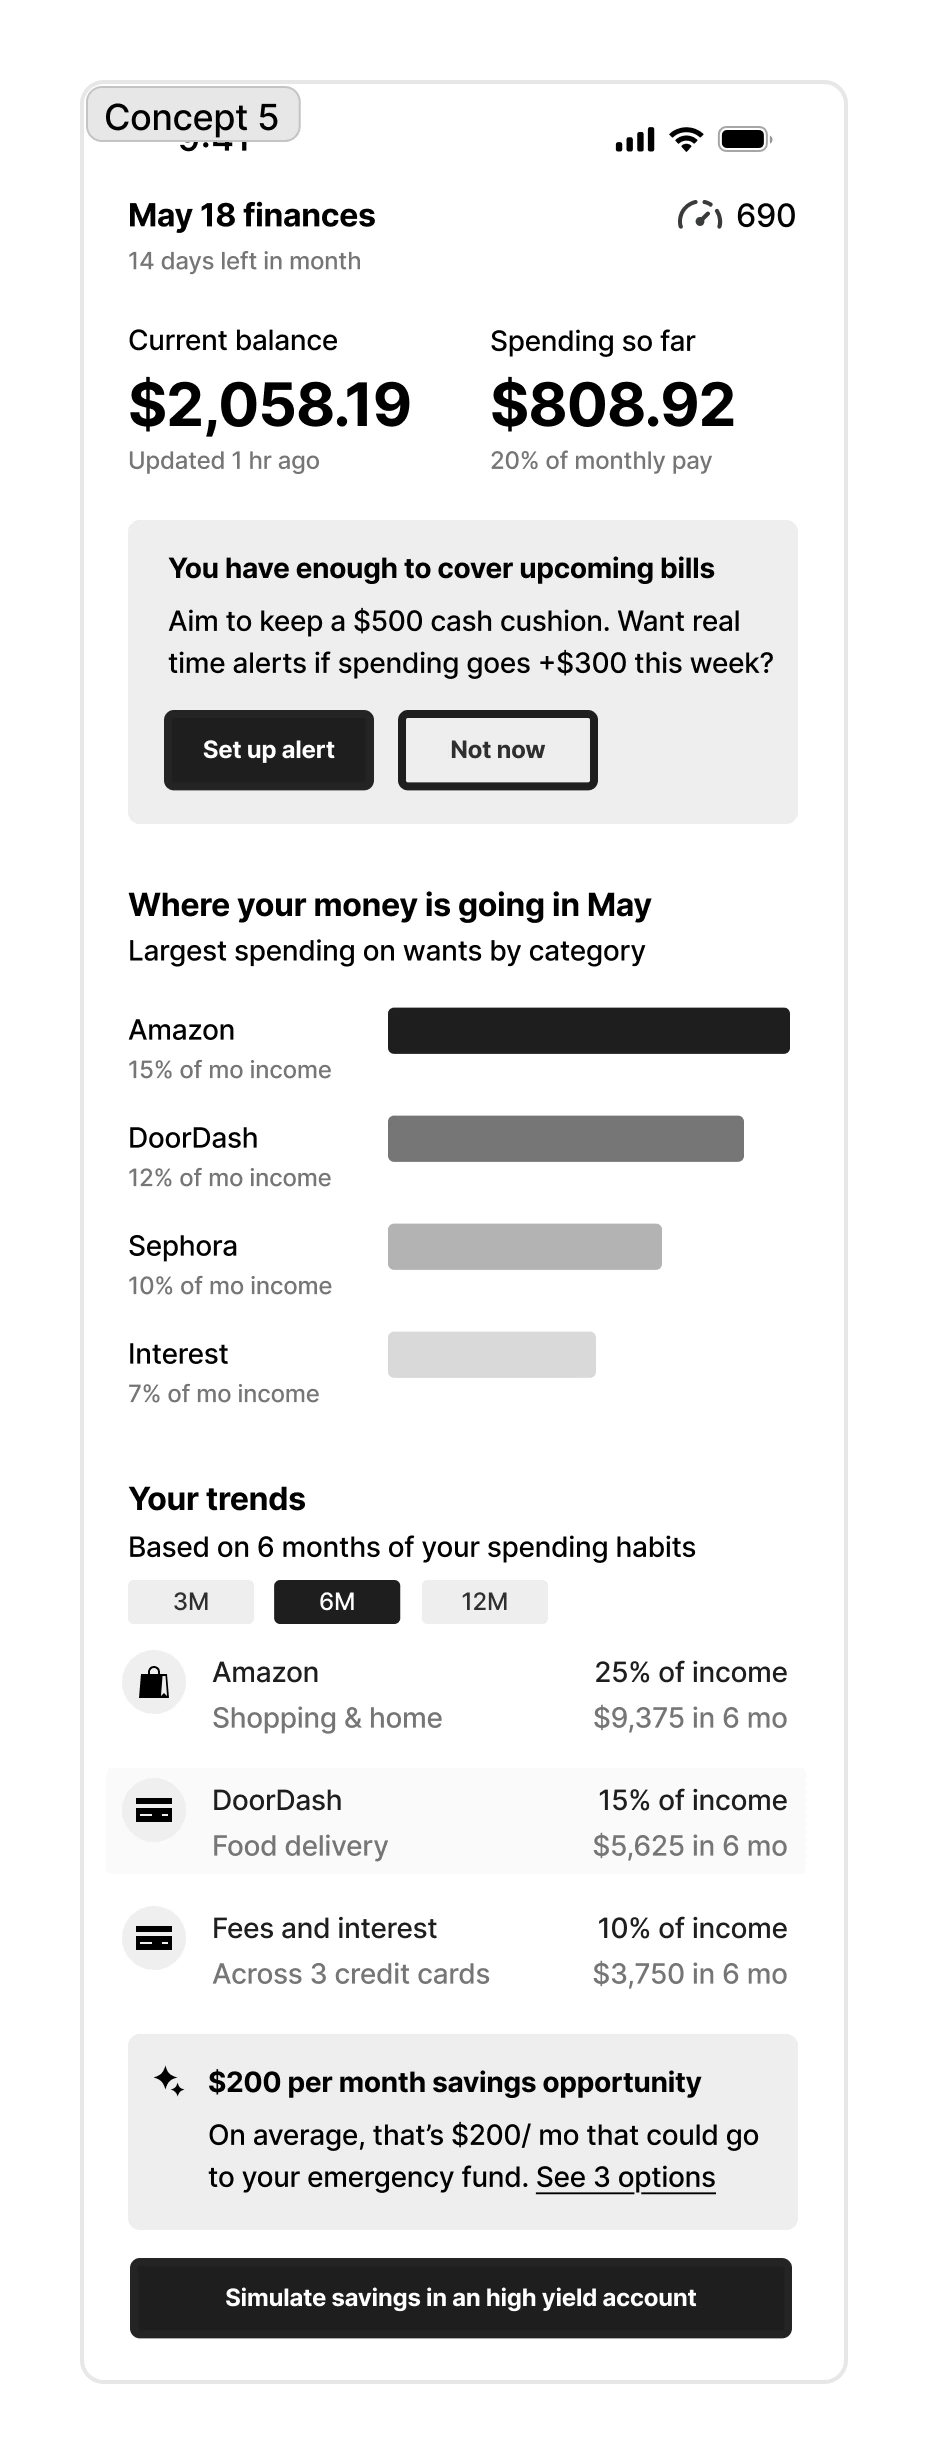
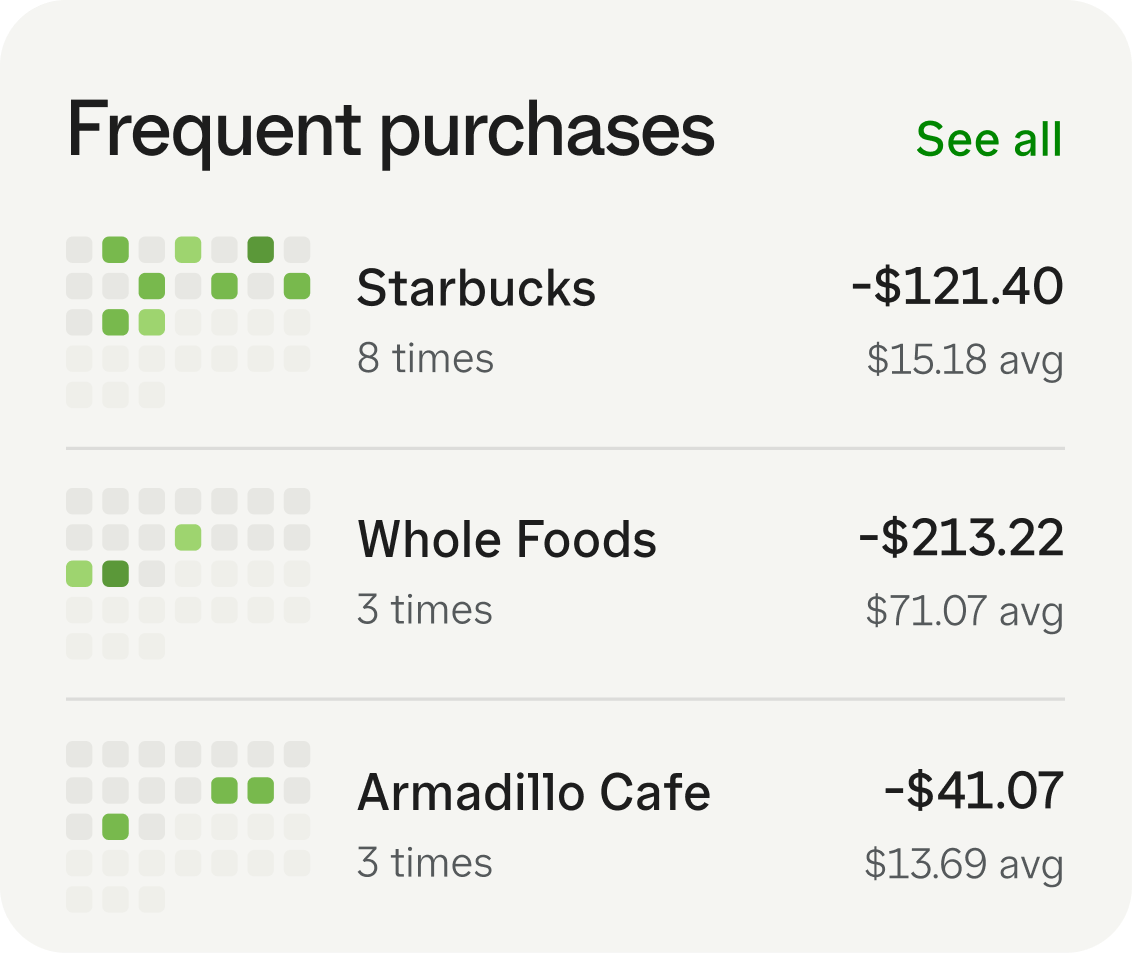
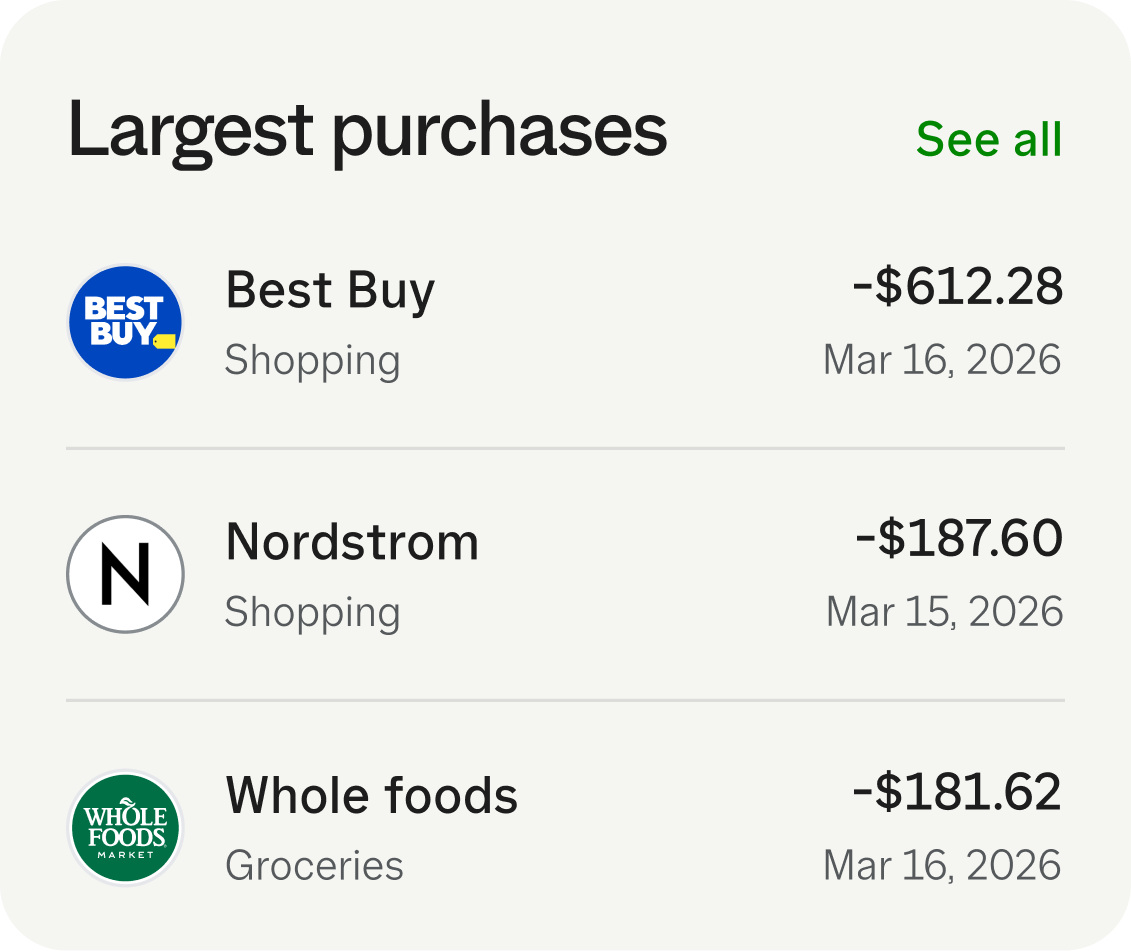
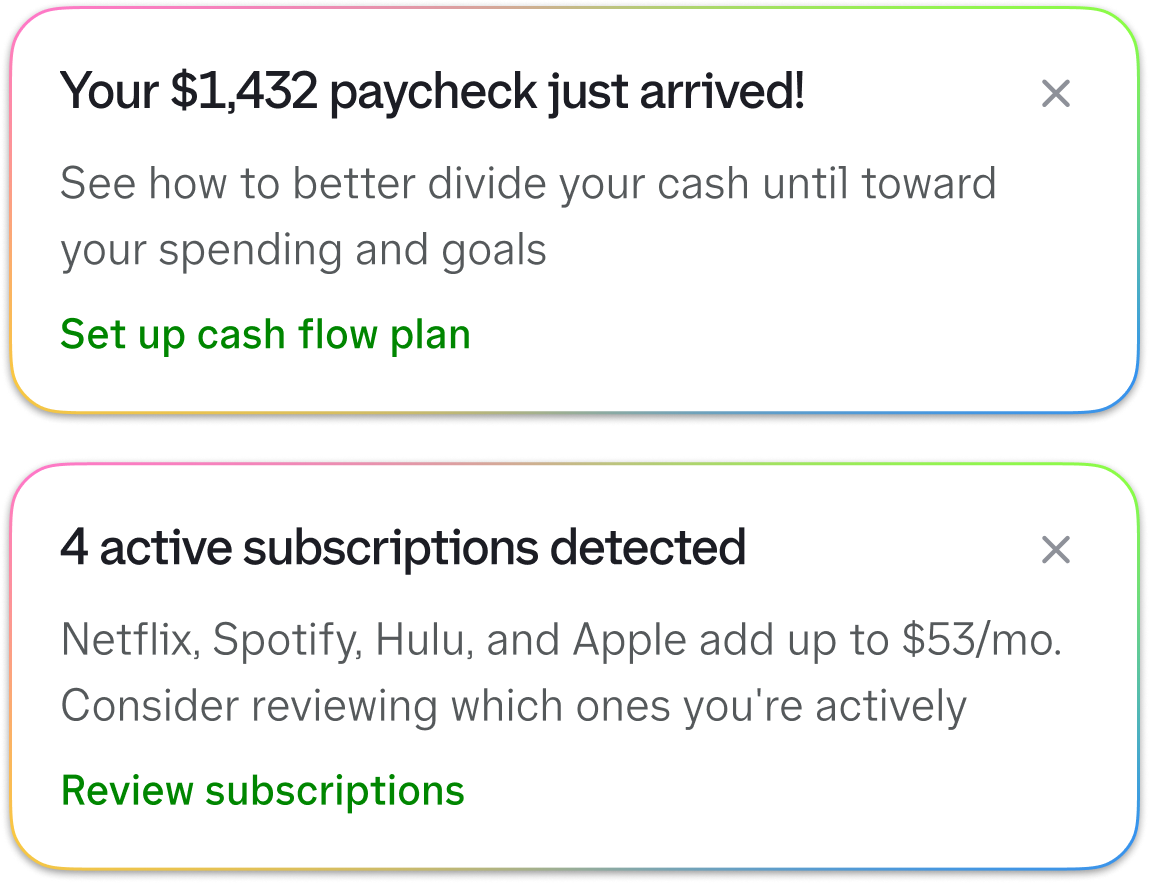
I added Income tracking and new slices of transaction history, including Frequent Transactions and Largest Transactions. An AI insights framework translated patterns in the data into explanations and actions users could take.
I built the cross-surface prototype in Cursor, connected it to real account data through the Plaid API, and distributed native iOS builds through TestFlight. Users and stakeholders could evaluate the motion, navigation, and relationships between surfaces on their own phones before the organization committed to the full system.
As these features moved into production, I used Claude Code to ship pull requests, partnering with senior engineers for code review. Using AI coding agents gave design and engineering a shared working prototype to refine together. We spent more time on motion, navigation, and smaller interaction details. That collaboration brought more polish into production.
Results
The releases established a new direction for Cashflow
Recurring Transactions, Bill Calendar, Available Cash, and the redesigned Cashflow surfaces worked from the same financial model. Three controlled experiments improved different measures of habitual engagement, showing that users returned more often when Cashflow helped them understand what was coming.
Recurring Transactions
- 3.07%
- Lift in monthly retention among users with connected accounts
Bill Calendar
- 3.04%
- Lift in 7-day return on iOS, relative to control
- 6.80%
- Lift in 7-day return on Android, relative to control
Available Cash
- 2.9%
- Lift in weekly active use
Weekly use grew among users with connected accounts
Over six months, the number of users with at least one connected financial account grew from 8.5M to more than 10M. Among that group, weekly visitors to either Cashflow or Available Cash grew from 2.78M to 4.38M, increasing weekly reach from 32.7% to 43.8%.
The controlled experiments measured the effects of individual releases. These six-month figures show the broader product trend. Together, they gave the team evidence to keep investing in forward-looking money management.
Among users with at least one connected financial account
Baseline: Before experiment rollouts
32.7%
weekly active
After six months of releases and iteration
43.8%
weekly active
From tracking money to helping users plan
Research showed that users wanted to understand what was coming and how much they could safely spend.
Recurring Transactions, Bill Calendar, and Available Cash brought upcoming income, bills, expenses, and available cash into one financial picture. Those releases established the direction for Credit Karma’s next phase of money-management work: helping users see a shortage early enough to act.